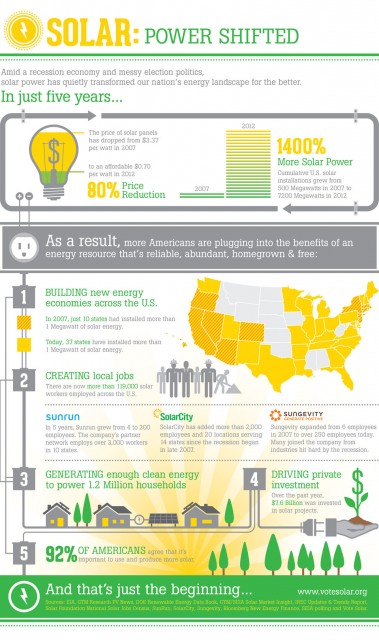
 Amid a recession economy and messy election politics, solar power has quietly transformed our nation’s energy landscape for the better.[/caption]
Last month, Brightergy celebrated it’s second birthday and the rapid growth we’ve experienced since our inception. As members of one of the United States’ fastest growing industries, change is expected – welcome, even. And as we near year’s end, we’re preparing for the coming new year by not only looking forward, but also by reflecting back on all we have accomplished this far, and all that we strive to improve upon, both as a company and an industry.
One of the more remarkable and positive signs of the solar industry’s promise has been the rapid decline in installation prices, paired with rapid market growth. According to a report released by the Department of Energy’s Lawrence Berkeley National Laboratory, the average cost of installing solar in the U.S. continued a steady decrease in 2011 and through the first half of 2012. Those who are interested in using this type of energy source can speak to their solar panel installation company to find out their particular going rate.
As Adam Brown, Executive Director of the Vote Solar Initiative said, “This report shows just how far solar power has come in the U.S., and how much more we can do. Faced with a recession economy, messy election politics and an entrenched electricity marketplace, solar is quietly defying the odds and reinventing our national energy landscape. It’s really remarkable.”
The annual report, “Tracking the Sun,” on solar photovoltaic costs in the United States examined more than 150,000 PV systems installed between 1998 and 2011, and included preliminary data from the Q1 and Q2 of 2012. Key findings highlighted the industry’s predominant trends of cost decline, record growth, and job growth in the face of an economic recession.
- In 2011, the average installed price of residential and commercial solar PV systems ranged from $6.1/Watt to $4.9/Watt, dependent on the size of the project. These prices reflect an 11-14% decrease from 2010; installed prices then fell an additional 3-7% in the first half of 2012.
- Installed PV prices have historically declined by an average of 5-7% per year, from nearly $12/@att in 1998, and with particularly sharp reductions each year since 2009.
- In large part, recent price declines are due to falling module prices, which declined by $2.1/Watt from 2008-2011, and have fallen deeper still in 2012.
- Non-module costs, or “soft” costs – including installation labor, overhead, marketing, inverters, and permitting fees – declined by roughly 30% between 1998 and 2011, but have not kept up with the same rate of rapid decline as module costs. This area has been marked for improvement, and, as reported by SEIA, “market-building policies that target non-module costs represent a significant opportunity for continued price reduction.”
As President and CEO of the Solar Energy Industry Association (SEIA) Rhone Resch put it, “declining costs have driven record growth over the last four years and we expect the solar market to double in 2012 and double again in 2013. This growth proves that smart federal and state energy policies diversify our energy portfolio and grow our economy. With 5,600 companies employing 119,000 Americans, the U.S. solar industry has become an economic engine for America.”
It also helps that even though the economy is struggling, investors are wanting to buy shares uk in solar companies or other eco-conscious companies because they know that when the economy recovers, it will be the solar industry that will be thriving because people are becoming more and more green. As our company has grown from 10 employees to 55; 1 small office to 3 locations in 2 different states; more than 400 projects completed in Missouri, we feel we’re living, breathing proof of the growth and promise of solar energy.
In addition to Tracking the Sun’s findings on the falling prices of solar installations, a number of recent reports have illustrated the industry trends mentioned earlier, including the dynamic infographic pictured at the top of this post, distributed by the Vote Solar Initiative.
- Market Growth: GTM Research and SEIA’s Solar Market Insight report found that PV installations totaled 742 megawatts (MW) in Q2 2012, representing an increase of 45% over the previous quarter and 116% over Q2 2011.
Job Growth: The Solar Foundation’s National Solar Jobs Census reported 119,000 Americans working in solar jobs across all 50 states. Over 2011, solar job growth outpaced the general economy with 13.2% annual growth.
Bipartisan Support: A 2012 Hart Research National Solar Survey found that 92% of Americans agree that it is important for the U.S. to use and develop more solar energy.